노인의 기능체력수준을 평가하기 위한 장수체력나이의 개발
Development of longevity fitness age for successful aging in elderly
Article information
Abstract
목적
본 연구는 65세 이상 노인의 기능체력수준을 평가하기 위한 장수체력나이(연령 척도)를 개발하고자 하였다.
방법
총 458명 (남성: 166명, 여성 292명)이 참여하였으며 설문 조사를 통하여 6대 질환(뇌혈관질환, 고혈압, 당뇨병, 심장질환, 호흡기질환, 비만)으로 판정되지 않은 경우는 건강집단으로 이중 한 가지라도 해당이 되는 경우는 만성질환집단으로 분류하였다. 연령 척도는 건강집단을 대상으로 개발되었으며 이를 만성질환집단에 적용하여 그 타당도를 검토하였다. 기능체력평가를 위하여 총 13가지 항목(악력, 연속상완굴신력, 눈뜨고 외발서기, 기거능력, 팔 앞으로 뻗기, 의자에 앉았다 일어나기, 일어나 걸어가기, 8자 보행, 5 m 보통 보행 및 최대보행, 일자로 걷기, 콩 옮기기, 봉 옮기기)을 시행하였다.
결과
연령 척도개발을 위해 주성분 분석을 시행하였으며 악력과 콩 옮기기를 제외한 모든 항목이 연령과 상관관계가 있었다. 건강집단과 만성질환집단 간 악력과 하지 기능 관련 변인의 차이가 나타났으며 장수체력나이 추정을 위해 총 4개의 변인이 선택되었다. 추정식은 다음과 같다.
장수체력나이=0.942*X1+2, 185*X2+0.673*X3+0.051*X4+0.588*실제나이+58.401
(X1=기거능력, sec (s), X2=5m 최대보행 (s), X3=s의자에 앉았다 일어나기, (s), X4=눈뜨고 외발서기 (s).)
건강집단의 경우 장수체력나이와 실제나이 간 차이가 나타나지 않았으나 만성질환집단은 차이가 나타났다. 만성질환집단 중 좌식 생활 집단은 운동 집단에 비해 그 차이가 더 크게 나타났다.
결론
따라서 장수체력나이는 건강관리가 요구되는 노인을 조기에 선별하기에 유용할 것으로 사료된다.
Trans Abstract
Purpose
Evaluating the aging of senior and providing optimal sevices are important things for successful aging. This study identified functional fitness related with heath of aged 65 years or older and developed an age scale (longevity fitness age) for assessing their aging.
Methods
Participants were 458 older people (166 male, 292 female). They were divided into healthy group and disease group. Healthy group was used for the development of the longevity age equation and disease group was for investigating the validity of the equation. Participants completed 13 function fitness variables. The first principal component obtained from a principal component analysis was used to compute the equation. All variables except for grip strength and carrying beans were correlated with chronological aged. Grip strength and variables related lower functional fitness had differences between healthy group and disease group. Finally, 4 variables were selected for the equation.
Results
It was the following: longevity fitness age=0.942*X1+2, 185*X2+0.673*X3+0.051*X4+0.588*chronological age+58.401, where X1=standing up from a supine position, sec (s), X2=maximum walking (s), X3=standing up and sitting down a chair (s), X4=one leg balance with eyes open (s). The longevity fitness age of healthy group do not have a difference compared to their chronological age but disease group had a difference significantly. Age difference (chronological age-longevity fitness age) of sedentary group in disease group was significantly bigger than its active group. Longevity fitness age could assess an aging of senior.
Conclusion
We suggest that it can use as the tool for early detecting senior who need the health care service.
서론
과학의 진보에 따른 의료기술의 발전이 현대사회에 가장 크게 기여한 것은 평균수명의 연장과 고령화 인구비율의 증가일 것이다. 노화(aging)가 진행될수록 만성질환(chronic disease)이 증가하고 신체적 기능(functional fitness)이 저하된다. 이로 인해 노인의 기대수명과 건강한 상태로 보내는 기간은 차이가 나타난다. 실제로 2014년 출생아의 기대수명은 남자 79.0년, 여자 85.5년이지만, 기대수명 중 질병이나 사고로 인해 아픈 기간을 제외한 건강한 상태로 보내는 기간은 남자 64.9년, 여자 65.9년으로 예상된다(Statistics Korea, 2014). 이러한 차이로 인해 건강관리(health care) 비용이 기하급수적으로 증가하고 있다(Lehnert et al., 2011). 수명의 연장이라는 과거로부터의 목표는 달성되었지만, 노인시기를 보낼 수 있는 삶의 질에 관한 과제는 지속적으로 해결해야 할 중요한 과제이다.
따라서 요양을 필요로 하는 노인의 건강증진은 사회적 목표라고 할 수 있으며 단순히 ‘수명 연장’ 보다는 ‘건강기간의 연장’을 성공적 노화(successful aging)라고 할 수 있다(Rowe &Kahn, 1997, ACSM, 2010). 성공적인 노화를 위해서 노인의 노화 정도를 주기적으로 평가하여 적절한 정보를 제공 또는 조정하여야 한다. 따라서 일상에서 쉽게 적용될 수 있는 노화 평가 방법이 필요하다.
노화는 유전요인과 활동 수준, 영양, 건강 상태 등 환경요인에 따라 개인차가 크기 때문에 실제나이(chronological age)로는 각 개인의 노화를 평가할 수 없다. 노화와 상관이 있는 다중변인을 분석하여 연령척도(Age scale)와 같은 하나의 지수로 평가할 것을 제언하였으며(Clark, 1960) 이와 관련된 여러 연구가 수행되었다. 헤모글로빈, 총 콜레스테롤 등의 혈액변인을 추정 변인으로 한 생물학적 연령(biological age)이 제언되었다(Nakamura et al., 1988; Nakamura & Miyao, 2007). 하지만 노화 정도는 일상적으로 쉽게 측정 및 평가가 가능하여야 하는데(Seino et al., 2013) 생물학적 연령은 혈액검사 및 호흡가스분석기와 같은 전문 장비가 요구되어 일상적인 측정이 어렵다. 노화를 예측하는 표지자(marker)는 노화속도를 예측할 수 있어야 하고, 노화과정을 추적 관찰할 수 있어야 하며 반복측정이 가능하며 사람에게 적용이 가능하여야 한다(Johnson, 2006). 유전자나 단백질과 같은 생체표지자(biomarker) 뿐만 아니라 노인의 신체적 기능도 노화예측 표지자가 될 수 있다(Seino et al., 2013). 노인의 신체적 능력은 근력(muscular strength), 보행속도(gate speed) 등과 같이 객관적 측정으로 평가할 수 있으며 이를 통해 일상생활동작(activities of daily living) 뿐만 아니라 낙상, 인지능력, 심혈관계 질환, 사망률을 예측하는 유용한 도구로 제안되고 있다(Cooper et al., 2011; Takata et al., 2008). 또한 요양소 입소(nursing home admission)가 요구되는 노인의 선별이 가능하다(Reuben et al., 1992; Guralnik et al., 1994). 이러한 노인의 신체적 기능을 추정 변인으로 이용한 연령척도로서 활력연령(vital age)도 보고되었다(Shigematsu & Tanaka, 2000; Figueroa et al., 2015). 하지만 활력연령은 독립적인 생활을 강조한 연령 척도이며 노인에게 문제가 되고 있는 만성질환(Multiple chronic conditions)에 대해 고려되지 않았다. 만성 질환은 상당한 의료비용 증가를 유발하며 기능장애, 삶의 질 저하, 사망률 증가 등과 상관이 있다(Lehnert et al., 2011). 특히, 노인 만성 질환자는 일상생활 수행에 대한 의존도가 높으며 이는 경제적 부담 및 정서적 부담감에 영향을 주는 것으로 나타나 이에 대한 방안이 필요하다(Bang & Jang, 2007).
따라서 본 연구는 노화 또는 노인의 만성 질환과 관련이 있는 신체적 기능을 선별하여 노화 평가 연령척도 추정식을 개발하고 그 타당도를 검토하였다.
연구방법
연구설계와 절차
본 연구는 노화 및 노인의 질환과 관련이 있는 신체적 기능을 선별하고 이를 이용하여 노화를 평가할 수 있는 연령척도 추정식을 개발하였다. 따라서 노인이 일상생활에서 필요한 가사, 쇼핑, 사회활동 등을 안전하게 영위하는데 필요한 능력을 ‘장수체력(longevity fitness)’으로 정의하고 장수체력나이를 추정하였다. 실제나이에 비해 장수체력나이가 많을수록 신체기능이 저하된 것으로 판단할 수 있다. 신체활동의 자립을 위해 1차 생활동작(주거, 가사, 기본적인 신변동작 등)과 2차 생활동작(이동능력, 사회활동, 건강증진 활동 등)으로 구분하여(Tanaka et al., 1990; Guralnik et al., 1994), 타당성(Bravo et al., 2010)와 신뢰도(Shaulis et al., 1994)가 높은 측정항목을 선택했다.
연구의 윤리적 고려를 위하여 일본 츠쿠바대학교의 임상윤리심의위원회의 승인<IRB No. 체24-122>을 받은 후 연구를 진행하였으며, 자료 수집은 2013년 2월부터 11월까지 10개월간 이루어졌으며 참여자에게 내용을 설명하고 실시하였다. 측정의 타당도를 위해 측정자에게 사전교육을 실시하였다. 신체기능 측정 방법 및 주의사항을 사전에 설명하여 안전사고를 예방하였다. 신체조성 분석 후 신체기능 측정을 실시하였다. 측정은 총 12항목으로 구성되었으며, 각 측정 시 휴식시간을 두어 참가자의 최대능력을 측정하고자 하였다.
연구대상자
서울, 부산, 홍천군에 거주하며 자발적 참여 의사를 가지고 있으며 직접 측정 장소까지 본인 스스로 이동이 가능한 65세 이상의 노인을 대상으로 하였다. 신체적 기능측정과 설문조사가 가능하며 본 연구의 목적을 이해한 458명(남성 166명, 여성 292명)이 참여하였다. 설문 조사에 의해 6대 질환(뇌혈관질환, 고혈압, 당뇨병, 심장질환, 호흡기질환, 비만)으로 판정되지 않은 경우는 건강집단으로, 이중 한 가지라도 해당이 되는 경우는 만성질환집단으로 분류하였다(Nakamura & Miyao, 2007). 각 집단 별 대상자의 신체적 특성은 <Table 1>과 같다.

Characteristics of healthy group and disease group
(M±SD)
신체구성
신장은 신장계를 이용하여 대상자가 시선을 전방으로 향하도록 한 후 측정하였다. 체중은 대상자가 가벼운 복장을 한 상태에서 체중계를 이용하여 측정하였다. 신체질량지수(body mass index: BMI)는 체중과 신장의 제곱 비율(kg/㎡)로 산출하였다.
신체적 기능 측정
연속상완굴신 그리고 콩옮기기, 봉옮기기를 제외한 모든 항목은 2회 실시하여 평균값을 구하였다.
악력(grip strength, kg)
양팔을 자연스럽게 벌린 후 편안한 자세에게 악력계(TKK 5101 Grip D; Takey, Tokio Japan)를 가능한 강하게 쥐게 하였다. 양손 모두 2회 측정하여 높은 값을 사용하였다.
연속상완굴신력(arm curl, num/30sec)
의자에 등을 기대지 않고 의자에 앉아서 오른손에 2.0 kg의 아령을 쥐고 30초 동안 가능한 빠르게 상하로 움직이게 하였다.
눈뜨고 외발서기(one leg balance with eyes open, sec)
눈을 뜬 상태로 양 팔을 허리에 대고 발을 바닥에서 약 10 cm 정도 들어 균형을 가능한 오랫동안 잡게 하였다. 한쪽 다리를 든 시점을 시작으로 균형을 잃은 시점에 종료하였다. 최대 유지시간은 60초로 하였다.
기거능력(standing up from a supine position, sec)
매트 위에 천장을 보고 누워 측정자의 신호와 함께 가능한 빨리 일어나 기립자세를 취하게 하고 그 시간을 측정하였다.
팔 앞으로 뻗기(functional reach, cm)
벽에 옆으로 선 자세에서 양손을 편 상태로 어깨의 높이까지 들게 하였다. 양손가락의 끝 부분을 0 cm위치로 설정하고 양손을 같은 높이로 유지시킨 후 가능한 한 상체를 앞으로 하여 최대 거리를 계측하였다.
의자에 앉았다 일어나기(standing up and sitting down a chair, sec)
의자에서 일어선 직립자세에서 시작하여 의자에 앉았다 일어나는 동작을 5회 되풀이 하여 그 시간을 측정하였다.
일어나 걸어가기(time up and go, sec)
의자에 앉은 상태에서 시작하여 3 m앞에 높은 반환점을 돌아와서 다시 제자리에 앉는 시간을 측정하였다.
8자 보행(walking around two cones in a figure 8, sec)
지면에 1.5×3.6 m의 선의 양쪽에 반환점을 설치하고 그 사이에 의자를 놓았다. 대상자는 앉은 자세에서 시작과 함께 한쪽의 반환점을 돌아와 앉고 계속해서 반대쪽 반환점을 돌아와 앉았다. 이를 2회 반복한 소요시간을 기록하였다.
5 m 보통 보행 및 최대보행(habitual walking, maximum walking, sec)
바닥에 그어진 5 m 보행로를 따라 걷게 하였으며 다리가 측정 시작선을 넘어서는 시점에서 다리가 종료시점을 넘어서는 순간까지의 소요시간을 측정하였다. 보통 걸음과 빠른 걸음으로 각각 시행하였다.
일자로 걷기(tandem walking, sec)
바닥에 그어진 3 m직선 위를 발 앞꿈치와 뒤꿈치를 붙여가면서 가능한 빨리 걷게 하여 시간을 측정하였다. 또한 측정 중 앞꿈치와 뒤꿈치가 붙지 않은 회수, 선을 밟지 않고 벗어난 회수, 벽에 손이 닿거나 균형이 무너진 횟수를 기록하고 이 경우 그 지점에서 다시 시작하였다.
콩 옮기기(carrying beans, num/30sec)
콩 60개가 담긴 용기를 왼쪽에 두고 20 cm 거리에 콩을 옮길 용기를 두었다. 대상자는 양 용기의 가운데 앉아 젓가락으로 콩을 한 개씩 30초 동안 이동하게 하였다.
봉 옮기기(manipulating pegs in a pegboard, num/30sec)
대상자로 하여금 48개의 페그 측정기의 중앙에 서게 한 후 시작 신호에 따라 양손으로 페그를 한 개씩 잡고 앞쪽의 비어있는 구멍에 넣게 하여 30초 동안 이동한 페그 개수를 측정하였다.
자료 분석
자료는 SPSS PC+/win 21.0통계 프로그램을 이용하였다. 모든 자료에 대해 평균과 표준편차를 산출하였다. 연령과 신체적 기능의 관련성 분석을 위해 상관관계분석(pearson’s correlation analysis)과 주성분 분석(principle component analysis)을 실시하였다. 나이를 제외한 신체적 기능변인으로 주성분 분석을 시행하여 장수체력나이 추정식을 위한 계수를 구하였다. 건강집단 또는 질환집단의 실제 나이와 장수체력나이 간 차이분석을 위해 대응표본 T검증을 실시하였다. 또한, 질환집단 내 운동집단과 비 운동집단의 실제 나이와 장수체력나이의 차이 분석을 위해 독립표본 T검증을 실시하였다. 모든 통계치의 유의수준은 p<.05로 설정하였다.
연구결과
실제나이와 신체적 기능의 관련성 분석
실제나이와 건강집단의 신체적 기능의 상관을 분석한 결과, 악력을 제외한 모든 항목에서 유의한 상관관계가 나타났다<Table 2>.

Correlation of Chronological Age and Physical Performance Items
건강집단과 질환집단간의 신체적 기능의 차이는 악력, 눈뜨고 외발서기, 기거능력, 의자에 앉았다 일어나기, 최대보행, 일자로 걷기에서 두 집단 사이에 유의한 차이(p<.05)가 있었다<Table 3>.

Differences of Physical Performance between Healthy group and Disease group
본 연구에서는 (1) 실제연령과 신체적 기능의 상관성과 (2) 건강집단과 질환집단 간 신체적 기능의 차이, (3) 측정의 용이성 및 안전성에 중점을 두어 장수체력나이 추정식 개발을 위한 4항목(눈뜨고 외발서기, 기립시간, 최대보행, 의자에서 앉았다 일어나기)이 선택되었다. 눈뜨고 외발서기는 평형성, 기립시간은 연속동작능력, 의자에서 앉았다 일어나기는 하지근력, 최대보행은 이동능력을 평가하는 항목이다. 채택된 4개의 신체적 기능과 실제나이의 관련성을 분석하기 위하여 주성분 분석을 시행하였다<Table 3>. 그 결과 한 개의 주성분에 실제나이를 비롯한 모든 항목이 유의한 적재치를 가지며 이 성분은 50.8%의 설명력을 나타냈으며 고유 값(eigen value)이 1 이상으로 나타나 실제나이와 채택된 신체적 기능항목들이 서로 관련이 있음을 알 수 있었다<Table 4>.

Principal Component Analysis of Chronological Age and Selected Physical Performance Items.
장수체력나이 추정식의 산출
실제나이를 제외하여도 채택 항목들은 한 개의 주성분에 유의한 적재치를 가지는 것으로 나타났다<Table 5>. 또한, 이 요인은 57.2% 설명력을 가지며 고유 값이 2.29로 나타났다.

Principal Component Analysis of Selected Physical Performance Items.
각 항목을 표준점수화하고 주성분 분석의 계수를 조합하면 다음과 같이 연령점수(Age score)를 구할 수 있다.
Age score=0.203X1+0.471X2+0.145X3 –0.011X4–3.447
(X1=기립시간(s), X2=최대보행(s), X3=의자에서 앉았다 일어나기(s), X4=눈뜨고 외발서기(s))
연령점수는 평균은 0, 표준편차는 1로 나타나므로 T scale을 이용하여 다음과 같이 연령척도(Age scale)로 변환하였다.
Age scale = 74.38+4.64*Age score
실제나이와 연령척도는 상관관계가 있었지만(r=0.412, p<.001) 회귀선의 양쪽 끝부분이 서로 차이가 크게 나타나<Fig. 1> 다음과 같이 보정(correction)을 하였다(Dubina et al., 1984).

Scatter plot between chronologica age and Age scale before and after correction.
cAge scale=(1-0.412)*(Chronological age-74.38)+Age scale
그 결과 보정 후 실제나이와 연령척도(cAge scale)의 상관계수(r)가 0.737로 보정 전보다 높아졌다(p<.001) <Fig. 1>. 따라서 최종 장수체력나이의 산출식은 아래와 같다.
장수체력나이=0.588*Chronological age-43.735+ 0.942*X1+2.185*X2+0.673*X3+0.051X4+58.409
(X1=기립시간(s), X2=최대보행(s), X3=의자에서 앉았다 일어나기(s), X4=눈뜨고 외발서기(s))
장수체력나이의 타당도 검증
장수체력나이의 타당도 검증을 위해 6대 질환 중 한 가지라도 질환을 가진 대상자를 질환집단으로 분류하고 실제나이와 장수체력나이를 비교하였다. 그 결과 건강 집단은 실제나이(74.3±4.6세)와 장수체력나이 (74.3±6.3세)에서 차이가 나지 않았지만(p=.907), 질환집단에서 실제나이(74.6±4.8세)보다 장수체력나이(76.0±6.3 세)가 높게 나타났다(p<.001)<Fig. 2>. 또한 질환집단을 운동습관유무로 집단을 나눠서 비교한 결과, 운동집단에 비해 비 운동집단에서 연령의 차이가 나타났다(p<.01) <Fig. 3>.
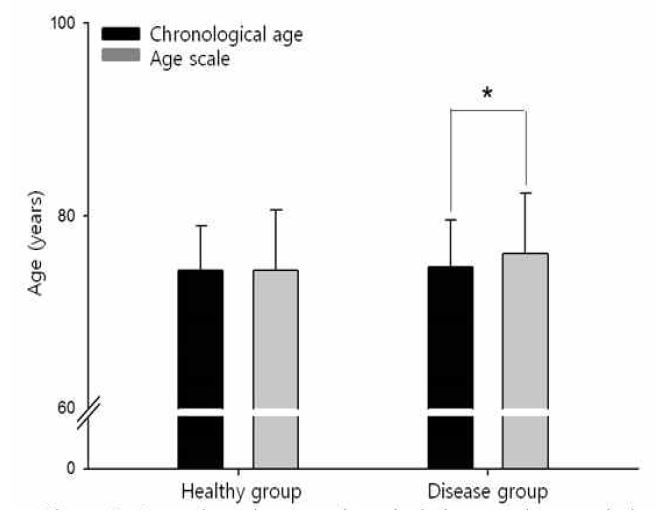
Comparisons between chronological age and age scal in the healthy group and the disease group.
* Significantly different from chronological age. p<0.05.

Comparisons of age difference between sedentary group and active group in disease group.
* Significantly different from sedentary group. p<0.05.
논의
급속한 인구노령화와 의료비 증가에 대처하기 위해서는 노인관련 서비스가 효율적으로 배치되어야 한다. 이를 위해서는 노인의 노화를 측정 평가를 통해 주기적으로 관리하고 이러한 평가를 통해 서비스 프로그램의 효과를 판정할 수 있어야 한다(June et al., 2009). 이는 일상생활체력 또는 인지기능 등과 관련된 설문조사를 이용하여 포괄적인 평가가 가능하지만(Kim et al., 2004) 주관적인 경향을 가지는 설문조사에 비해 신체적 기능의 직접적인 측정은 노인의 신체적 건강상태를 객관적으로 예측 할 수 있을 뿐만 아니라 재현이 가능하고 나아가 변화를 평가할 수 있다는 장점이 있다(Kempen et al., 1996; Studenski et al., 2003). 또한 임상에서 노인에게 안전하고 흥미 있게 적용이 가능하다(Guralnik et al., 1994). 따라서 본 연구는 노인의 건강한 자립생활을 영위하기 위한 신체기능을 일상생활에서 쉽게 측정 및 평가할 수 있는 장수체력나이(연령척도)를 개발하였다.
본 연구에서 측정한 신체적 기능 항목은 선행연구를 참고하여 채택하였다(Tanaka et al., 1990; Guralnik et al., 1994; Steffen et al., 2002; Pedrero-Chamizo et al., 2012). 안전성과 측정의 용이성을 고려하여 타당도와 신뢰도가 높은 13개 항목(악력, 연속상완굴신, 외발서기, 기거능력, 기능적 팔 뻗기, 의자에 앉았다 일어나기, 일어나 걸어가기, 8자 보행, 5m 보통 보행 및 최대 보행, 일자로 걷기, 콩 옮기기, 봉 옮기기)을 측정하였다.
건강집단과 질환집단 사이에 신체적 기능의 차이를 분석한 결과 악력과 함께 하지 기능에서 차이가 나타났으나, 악력과 콩 옮기기를 제외한 항목이 실제나이와 상관관계가 나타났다. 악력의 경우, 여자가 남자에 비해 근육량이 적고 이러한 차이는 상지에서 더욱 크게 나타나서 남녀 전체를 대상으로 하는 경우 악력과 같은 상지 기능으로 실질적인 건강상태를 반영하기에는 어려움이 있다(Janssen et al., 2000). 하지만 하지의 기능은 상지보다 근 손실이 더욱 빠르고 이로 인해 기능저하도 크기 때문에(Rikli & Jones, 1997) 노인의 사망률(mortality)과 요양률(hospitalization), 허약(frailty)과 상관이 높다(Guralnik et al., 1994; Seino et al., 2009; Chang et al., 2014). 따라서 본 연구에서는 장수체력나이의 추정식 산출을 위한 추정 변인으로 눈뜨고 외발서기, 기립시간, 최대보행, 의자에서 앉았다 일어나기를 채택하였다.
빠른 노화 속도로 인해 노인의 독립적인 일상생활을 영위하기 위한 신체적 기능 평가는 65세 이하 성인과 구분하여 평가해야 한다(Nakamura &Miyao, 2007). 평가 시 항목별로 규준지향(norm)평가가 가능하고 항목별 평가는 부족한 기능에 대한 이해도를 높일 수 있으나 전체적인 상태에 대한 평가를 할 수 없으며 노화 및 신체적 기능의 평가는 여러 표지자를 통합하여 하나의 지수로 평가해야 한다 (Cooper et al., 2011; Cohen et al., 2015). 노인의 신체적 기능 평가를 위한 통합 측정법(Comprehensive test battery)이 여러 연구에서 보고되어 있다(Guralnik et al., 2000; Shigematsu & Tanaka, 2000; Seino et al., 2013).
회귀분석에 의해 개발된 추정식은 양쪽 끝부분에 과대평가 또는 과소평가가 나타나는 한계점이 드러나서(Nes et al., 2011) 주성분분석을 통해 산출된 제1주성분이 가장 큰 분산을 설명함으로 이를 이용한 점수를 상관계수로 보정하여 적용하였다(Nakamura et al., 1988; Dubina et al., 1984). 1차 주성분분석에서 실제나이가 신체적 기능항목과 하나의 주성분으로 분류되는 것을 확인하여 채택된 신체적 기능이 실제나이와 관련성을 가진다는 것을 알 수 있었다. 2차 주성분분석에서는 실제 나이를 제외한 신체적 기능항목으로 분석을 실시하여 연령점수를 얻기 위한 계수를 산출하였다. 이를 상관계수로 보정하여 실제나이와 높은 상관을 나타내는 장수체력나이 추정식을 구할 수 있었으며 건강 노인의 실제나이와 장수체력나이는 차이가 나타나지 않았다. 그러나 노인질환자는 실제나이에 비해 장수체력나이가 높게 나타나 본 연구에서 개발한 추정식을 통해 건강노인과 질환노인을 선별할 수 있다고 사료된다. 또한 운동습관이 있는 노인은 질환이 있어도 실제나이와 장수체력나이에서 차이가 나지 않았다. 이러한 결과는 산출된 추정식을 활용하여 적절한 서비스를 노인들에게 제공할 수 있으며 서비스의 효과를 판정하는데 사용할 수 있다고 사료된다.
만성질환은 일정 시간이 경과한 질환으로 비전염성인 퇴행성 질환을 말한다. 이는 일반적으로 원인이 불명확하고 다원적인 특성을 가지며 이로 인해 기증적 장애가 일어날 수 있고 치료가 어려운 특징을 가진다. 노인은 이로 인해 신체적 기능 및 삶의 저하가 일어나며 사망률의 원인이 되기도 한다. 본 연구를 통해 개발된 노화 평가 연령척도는 일상에서 쉽게 측정할 수 있고 평가 및 이해가 용이하므로 이를 통해 주기적으로 노인들을 관찰할 수 있다. 따라서 이를 임상에 적용한다면 질환노인을 조기에 선별하여 적절한 시기에 노인 관련 서비스를 제공함으로써 만성질환으로 인한 노인들의 노화를 미연에 방지할 수 있을 것으로 사료된다.
본 연구는 개발한 연령척도의 타당도 분석을 위하여 질환집단에 적용하여 그 차이를 확인하였으나 노화 개선을 위한 중재에 대한 효과를 검증할 수 있는지 알아보기 위하여 신체적 기능 측정과 함께 혈액분석 또는 혈압 측정을 병행한 종단 연구가 필요하다. 또한, 본 연구는 재가 노인을 대상으로 하였으므로 연구 결과를 시설거주 노인에게는 적용시킬 수가 없다. 본 연령척도를 시설거주 노인에게 적용시킨다면 독립생활을 유지할 수 있는 최소한의 기능 수준을 찾을 수 있을 것이다.
결론 및 제언
본 연구는 국내 4개 지역에 거주하는 65세 이상의 노인 458명을 대상으로 일상생활과 관련이 있는 신체적 기능을 선별하여 신체적 노화 평가를 위한 장수체력나이를 개발하고 그 타당성을 검토하였다. 그 결과, 연령척도는 아래와 같다.
장수체력나이=0.588*Chronological age-43.735+ 0.942*X1+2.185*X2+0.673*X3+0.051X4+58.409
(X1=기립시간(s), X2=최대보행(s), X3=의자에서 앉았다 일어나기(s), X4=눈뜨고 외발서기(s)).
본 연구에서 제안된 연령척도는 연령증가에 따라 변화하는 광범위한 신체적 기능 수준을 반영할 수 있을 뿐 아니라 안전하고 용이하게 평가할 수 있는 항목으로 구성되어 있어 활용성이 높다고 사료된다. 또한 노인이라도 알기 쉬운 형태의 신체적 기능상태를 종합적으로 평가하여 건강을 위한 생활습관의 정착을 향한 동기유발 등 국민의 건강 증진에 이바지할 것이다.
References
American College of Sports Medicine(ACSM).(2010). ACSM's guidelines for exercise testing and prescription(8th). Lippincott Williams and Wilkins: Philadelphia, PA.
American College of Sports Medicine(ACSM). 2010. ACSM's guidelines for exercise testing and prescription 8thth ed. Lippincott Williams and Wilkins. Philadelphia, PA:Bang, S. H., & Jang, H.J. (2007). Activities of daily living of the elderly with a chronic disease and burden on family care-givers. Journal of Korean Academy of Nursing, 37(1), 135-144.
Bang S. H., et al, Jang H.. 2007;Activities of daily living of the elderly with a chronic disease and burden on family care-givers. Journal of Korean Academy of Nursing 37(1):135–144. 10.4040/jkan.2007.37.1.135.Bravo, G., Gauthier, P., Roy, P. M., Tessier, D., Gaulin, P., Dubois, M. F, , & Péloquin, L. (2010). The Functional Fitness Assessment Battery: Reliability and Validity Data for Elderly Women for Patients With Alzheimer's Disease: The TEMP-AD Protocol. Journal of Aging and Physical Activity, 2(1), 67-79.
Bravo G., Gauthier P., Roy P. M., Tessier D., Gaulin P., Dubois M., et al, Péloquin L.. 2010;The Functional Fitness Assessment Battery: Reliability and Validity Data for Elderly Women for Patients With Alzheimer's Disease: The TEMP-AD Protocol. Journal of Aging and Physical Activity 2(1):67–79.Chang, S. F., Yang, R. S., Lin, T. C., Chiu, S. C., Chen, M. L., & Lee, H. C. (2014). The Discrimination of Using the Short Physical Performance Battery to Screen Frailty for Community‐Dwelling Elderly People. Journal of nursing scholarship, 46(3), 207-215.
Chang S. F., Yang R. S., Lin T. C., Chiu S. C., Chen M. L., et al, Lee H. C.. 2014. The Discrimination of Using the Short Physical Performance Battery to Screen Frailty for Community‐Dwelling Elderly People. Journal of nursing scholarship 46(3)207–215. 10.1111/jnu.12068.Clark, J. W. (1960). The aging dimension: a factorial analysis of individual differences withage on psychological and physiological measurements. Journal of Gerontology, 15, 183-187.
Clark J.. 1960;The aging dimension: a factorial analysis of individual differences withage on psychological and physiological measurements. Journal of Gerontology 15:183–187. 10.1093/geronj/15.2.183.Cohen, A. A., Milot, E., Li, Q., Bergeron, P., Poirier, R., Dusseault-Bélanger, F., & Fried, L. P., (2015). Detection of a Novel, Integrative Aging Process Suggests Complex Physiological Integration. PloS one, 10(3), e0116489.
Cohen A. A., Milot E., Li Q., Bergeron P., Poirier R., Dusseault-Bélanger F., et al, Fried L. P.. 2015;Detection of a Novel, Integrative Aging Process Suggests Complex Physiological Integration. PloS one 10(3):e0116489. 10.1371/journal.pone.0116489.Cooper, R., Kuh, D., Cooper, C., Gale, C. R., Lawlor, D. A., Matthews, F., & Hardy, R. (2011). Objective measures of physical capability and subsequent health: a systematic review. Age and ageing, 40(1), 14-23.
Cooper R., Kuh D., Cooper C., Gale C. R., Lawlor D. A., Matthews F., et al, Hardy R.. 2011;Objective measures of physical capability and subsequent health: a systematic review. Age and ageing 40(1):14–23. 10.1093/ageing/afq117.Dubina, T., Mints, A. Y., & Zhuk, E. (1984). Biological age and its estimation. III. Introduction of a correction to the multiple regression model of biological age and assessment of biological age in cross-sectional and longitudinal studies. Experimental gerontology, 19(2), 133-143.
Dubina T., Mints A. Y., et al, Zhuk E.. 1984;Biological age and its estimation. III. Introduction of a correction to the multiple regression model of biological age and assessment of biological age in cross-sectional and longitudinal studies. Experimental gerontology 19(2):133–143. 10.1016/0531-5565(84)90016-0.Figueroa, R., Seino, S., Yabushita, N., Okubo, Y., Osuka, Y., Nemoto, M., Jung, S., & Tanaka, K. (2015). Age Scale for Assessing Activities of Daily Living. International Journal of Statistics in Medical Research, 4(1), 48-56.
Figueroa R., Seino S., Yabushita N., Okubo Y., Osuka Y., Nemoto M., Jung S., et al, Tanaka K.. 2015;Age Scale for Assessing Activities of Daily Living. International Journal of Statistics in Medical Research 4(1):48–56.Guralnik, J. M., Ferrucci, L., Pieper, C. F., Leveille, S. G., Markides, K. S., Ostir, G. V., Studenski, S., Berkman, L. F., & Wallace, R. B. (2000). Lower extremity function and subsequent disability consistency across studies, predictive models, and value of gait speed alone compared with the Short Physical Performance Battery. The Journals of Gerontology Series A: Biological Sciences and Medical Sciences, 55(4), M221-M231.
Guralnik J. M., Ferrucci L., Pieper C. F., Leveille S. G., Markides K. S., Ostir G. V., Studenski S., Berkman L. F., et al, Wallace R. B.. 2000;Lower extremity function and subsequent disability consistency across studies, predictive models, and value of gait speed alone compared with the Short Physical Performance Battery. The Journals of Gerontology Series A: Biological Sciences and Medical Sciences 55(4):M221–M231. 10.1093/gerona/55.4.m221.Guralnik, J. M, Simonsick, E. M., Ferrucci, L., Glynn, R. J., Berkman, L. F., Blazer, D. G., Scherr, P. A., & Wallace, R. B. (1994). A short physical performance battery assessing lower extremity function: association with self-reported disability and prediction of mortality and nursing home admission. Journal of Gerontology. 49(2), M85-M94.
Guralnik J. M, Simonsick E. M., Ferrucci L., Glynn R. J., Berkman L. F., Blazer D. G., Scherr P. A., et al, Wallace R. B.. 1994;A short physical performance battery assessing lower extremity function: association with self-reported disability and prediction of mortality and nursing home admission. Journal of Gerontology 49(2):M85–M94. 10.1093/geronj/49.2.m85.Janssen, I., Heymsfield, S. B., Wang, Z., & Ross, R. (2000). Skeletal muscle mass and distribution in 468 men and women aged 18–88 yr. Journal of Applied Physiology, 89(1), 81-88.
Janssen I., Heymsfield S. B., Wang Z., et al, Ross R.. 2000;Skeletal muscle mass and distribution in 468 men and women aged 18–88 yr. Journal of Applied Physiology 89(1):81–88. 10.1152/jappl.2000.89.1.81.Johnson, T. E. (2006). Recent results: biomarkers of aging. Experimental gerontology, 41(12), 1243-1246.
Johnson T. E.. 2006;Recent results: biomarkers of aging. Experimental gerontology 41(12):1243–1246. 10.1016/j.exger.2006.09.006.June, K. J., Lee, J. Y., & Yoon, J. L. (2009). Effects of case management using resident assessment instrument-home care (RAI-HC) in home health services for older people. Journal of Korean Academy of Nursing, 39(3), 366-375.
June K. J., Lee J. Y., et al, Yoon J. L.. 2009;Effects of case management using resident assessment instrument-home care (RAI-HC) in home health services for older people. Journal of Korean Academy of Nursing 39(3):366–375. 10.4040/jkan.2009.39.3.366.Kempen, G. I., Steverink, N., Ormel, J., &Deeg, D. J. (1996). The assessment of ADL among frail elderly in an interview survey: self-report versus performance-based tests and determinants of discrepancies. The Journals of Gerontology Series B: Psychological Sciences and Social Sciences, 51(5), P254-P260.
Kempen G. I., Steverink N., Ormel J., et al, Deeg D. J.. 1996;The assessment of ADL among frail elderly in an interview survey: self-report versus performance-based tests and determinants of discrepancies. The Journals of Gerontology Series B: Psychological Sciences and Social Sciences 51(5):P254–P260. 10.1093/geronb/51b.5.p254.Kim, E. K., Park, H. Y., & Kim, C. Y. (2004). On the feasibility of a RUG-III based payment system for long-term care facilities in Korea. Journal of Korean Academy of Nursing, 34(2), 278-289
. Kim E. K., Park H. Y., et al, Kim C. Y.. 2004;On the feasibility of a RUG-III based payment system for long-term care facilities in Korea. Journal of Korean Academy of Nursing 34(2):278–289. 10.4040/jkan.2004.34.2.278.Laforest, S., St-Pierre, D. M., Cyr, J., &Gayton, D. (1990). Effects of age and regular exercise on muscle strength and endurance. European journal of applied physiology and occupational physiology, 60(2), 104-111.
Laforest S., St-Pierre D. M., Cyr J., et al, Gayton D.. 1990;Effects of age and regular exercise on muscle strength and endurance. European journal of applied physiology and occupational physiology 60(2):104–111. 10.1007/bf00846029.Lehnert, T., Heider, D., Leicht, H., Heinrich, S., Corrieri, S., Luppa, M., Riedel-Heller, S., & Konig, H. H. (2011). Review: health care utilization and costs of elderly persons with multiple chronic conditions. Medical Care Research and Review, 68(4), 387-420.
Lehnert T., Heider D., Leicht H., Heinrich S., Corrieri S., Luppa M., Riedel-Heller S., et al, Konig H. H.. 2011;Review: health care utilization and costs of elderly persons with multiple chronic conditions. Medical Care Research and Review 68(4):387–420. 10.1177/1077558711399580.Mahoney, F. I., & Barthel, D. W. (1965). Functional evaluation: The barthel index. Maryland State Medical Journal, 14, 61-65.
Mahoney F. I., et al, Barthel D. W.. 1965;Functional evaluation: The barthel index. Maryland State Medical Journal 14:61–65.Nakamura, E., & Miyao, K. (2007). A method for identifying biomarkers of aging and constructing an index of biological age in humans. The Journals of Gerontology Series A: Biological Sciences and Medical Sciences. 62(10), 1096-1105.
Nakamura E., et al, Miyao K.. 2007;A method for identifying biomarkers of aging and constructing an index of biological age in humans. The Journals of Gerontology Series A: Biological Sciences and Medical Sciences :1096–1105.Nakamura, E., Miyao, K., & Ozeki, T. (1988). Assessment of biological age by principal component analysis. Mechanisms of Ageing and Development, 46(1-3), 1-18.
Nakamura E., Miyao K., et al, Ozeki T.. 1988;Assessment of biological age by principal component analysis. Mechanisms of Ageing and Development 46(1-3):1–18. 10.1016/0047-6374(88)90109-1.Nes, B. M., Janszky, I., Vatten, L. J., Nilsen, T. I., Aspenes, S. T., & Wisloff, U. (2011). Estimating V.O 2peak from a nonexercise prediction model: the HUNT Study, Norway. Medical and Science in Sports and Exercise, 43(11), 2024-2030.
Nes B. M., Janszky I., Vatten L. J., Nilsen T. I., Aspenes S. T., et al, Wisloff U.. 2011;Estimating V.O 2peak from a nonexercise prediction model: the HUNT Study, Norway. Medical and Science in Sports and Exercise 43(11):2024–2030.Pedrero-Chamizo, R., Gomez-Cabello, A., Delgado, S., Rodrímguez-Llarena, S., Rodríguez-Marroyo, J., Cabanillas, E., Melendez, A., Vicente-Rodríeguez, G., Aznar, S., & Villa, G. (2012). Physical fitness levels among independent non-institutionalized Spanish elderly: The elderly EXERNET multi-center study. Archives of gerontology and geriatrics, 55(2), 406-416.
Pedrero-Chamizo R., Gomez-Cabello A., Delgado S., Rodrímguez-Llarena S., Rodríguez-Marroyo J., Cabanillas E., Melendez A., Vicente-Rodríeguez G., Aznar S., et al, Villa G.. 2012;Physical fitness levels among independent non-institutionalized Spanish elderly: The elderly EXERNET multi-center study. Archives of gerontology and geriatrics 55(2):406–416. 10.1016/j.archger.2012.02.004.Reuben, D. B., Siu, A. L., & Kimpau, S. (1992). The predictive validity of self-report and performance-based measures of function and health. Journal of Gerontology, 47(4), M106-M110.
Reuben D. B., Siu A. L., et al, Kimpau S.. 1992;The predictive validity of self-report and performance-based measures of function and health. Journal of Gerontology 47(4):M106–M110. 10.1093/geronj/47.4.m106.Reuben, D. B., Laliberte, L., Hiris, J., & Mor, V. (1990). A hierarchical exercise scale to measure function at the Advanced Activities of Daily Living (AADL) level. Journal of the American Geriatrics Society, 38(8), 855-861.
Reuben D. B., Laliberte L., Hiris J., et al, Mor V.. 1990;A hierarchical exercise scale to measure function at the Advanced Activities of Daily Living (AADL) level. Journal of the American Geriatrics Society 38(8):855–861. 10.1111/j.1532-5415.1990.tb05699.x.Rikli, R. E., & Jones, C. J. (1999). Functional fitness normative scores for community-residing older adults, ages 60-94. Journal of Aging and Physical Activity, 7, 162-181.
Rikli R. E., et al, Jones C. J.. 1999;Functional fitness normative scores for community-residing older adults, ages 60-94. Journal of Aging and Physical Activity 7:162–181. 10.1123/japa.7.2.162.Rowe, J. W., & Kahn, R. L. (1997). Successful aging. The gerontologist, 37(4), 433-440.
Rowe J. W., et al, Kahn R. L.. 1997;Successful aging. The gerontologist 37(4):433–440.Tanaka, K., Matsuura, Y., Nakadomo, F., & Nakamura, E. (1990). Assessment of vital age of Japanese women by principal component analysis. Japan Journal of Physical Education, 35, 121-131.
Tanaka K., Matsuura Y., Nakadomo F., et al, Nakamura E.. 1990;Assessment of vital age of Japanese women by principal component analysis. Japan Journal of Physical Education 35:121–131. 10.5432/jjpehss.kj00003391743.Takata, Y., Ansai, T., Soh, I., Kimura, Y., Yoshitake, Y., Sonoki, K., Awano, S., Kagiyama. S., Yoshida, A., Nakamichi, I., Hamasaki, T., Torisu, T., Toyoshima, K., & Takehara, T. (2008). Physical fitness and cognitive function in an 85-year-old community-dwelling population. Gerontology, 54(6), 354-360.
Takata Y., Ansai T., Soh I., Kimura Y., Yoshitake Y., Sonoki K., Awano S., Kagiyama. S., Yoshida A., Nakamichi I., Hamasaki T., Torisu T., Toyoshima K., et al, Takehara T.. 2008;Physical fitness and cognitive function in an 85-year-old community-dwelling population. Gerontology 54(6):354–360. 10.1159/000129757.Seino, S., Yabushita, N., Kim, M. j., Nemoto, M., Jung, S., Osuka, Y., Okubo, Y., Figueroa, F., Matsuo, T., & Tanaka, K. (2013). Physical performance measures as a useful indicator of multiple geriatric syndromes in women aged 75 years and older. Geriatrics & gerontology international, 13(4), 901-910.
Seino S., Yabushita N., Kim M. j., Nemoto M., Jung S., Osuka Y., Okubo Y., Figueroa F., Matsuo T., et al, Tanaka K.. 2013;Physical performance measures as a useful indicator of multiple geriatric syndromes in women aged 75 years and older. Geriatrics & gerontology international 13(4):901–910. 10.1111/ggi.12029.Seino, S., Yabushita, N., Kim, M., Nemoto, M., Matsuo, T., Fukasaku, T., & Tanaka, K. (2009). A functional fitness test battery for pre-frail older adults (so-called" specified elderly individuals"). Japanese journal of public health, 56(10), 724-736.
Seino S., Yabushita N., Kim M., Nemoto M., Matsuo T., Fukasaku T., et al, Tanaka K.. 2009;A functional fitness test battery for pre-frail older adults (so-called" specified elderly individuals"). Japanese journal of public health 56(10):724–736.Shaulis, D., Golding, L. A., & Tandy, R. D. (1994). Reliability of the AAHPERD functional fitness assessment across multiple practice sessions in older men and women. Journal of Aging and Physical Activity, 2(3), 273-279.
Shaulis D., Golding L. A., et al, Tandy R. D.. 1994;Reliability of the AAHPERD functional fitness assessment across multiple practice sessions in older men and women. Journal of Aging and Physical Activity 2(3):273–279. 10.1123/japa.2.3.273.Shigematsu, R., & Tanaka, K. (2000). Age scale for assessing functional fitness in older Japanese ambulatory women. Aging Clinical and Experimental Research., 12(4), 256-263.
Shigematsu R., et al, Tanaka K.. 2000;Age scale for assessing functional fitness in older Japanese ambulatory women. Aging Clinical and Experimental Research. 12(4):256–263. 10.1007/bf03339845.Statistics Korea. (2014). Life tables of Korea Seoul: Statistics Korea.
Statistics Korea. 2014. Life tables of Korea Seoul: Statistics Korea.Steffen, T. M., Hacker, T. A., & Mollinger, L. (2002). Age-and gender-related test performance in community-dwelling elderly people: Six-Minute Walk Test, Berg Balance Scale, Timed Up & Go Test, and gait speeds. Physical therapy, 82(2), 128-137.
Steffen T. M., Hacker T. A., et al, Mollinger L.. 2002;Age-and gender-related test performance in community-dwelling elderly people: Six-Minute Walk Test, Berg Balance Scale, Timed Up & Go Test, and gait speeds. Physical therapy 82(2):128–137. 10.1093/ptj/82.2.128.Studenski, S., Perera, S., Wallace, D., Chandler, J. M, , Duncan, P. W., Rooney, E., Fox, M., & Guralnik, J. M. (2003). Physical performance measures in the clinical setting. Journal of the American Geriatrics Society, 51(3), 314-322.
Studenski S., Perera S., Wallace D., et al, Chandler J., Duncan P. W., Rooney E., Fox M., et al, Guralnik J. M.. 2003;Physical performance measures in the clinical setting. Journal of the American Geriatrics Society 51(3):314–322. 10.1046/j.1532-5415.2003.51104.x.