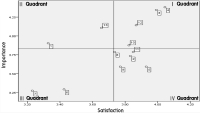
Purpose The purpose of this study is to grasp consumers' perception of badminton racket brand image using MDS and ISA. Methods To do this, we conducted questionnaires on those who participated in badminton and had experience of participating for 6 months or more in Seoul and Gyeonggi province from April 12 to 28, 2017, selected and analyzed a total of 313 copies as valid samples of this study. Results The results of study are as follows. First, as a result of MDS analysis, it showed that only the price of brand image attributes were in order of Trion > Joobong > Lining > Victor > Yonex, and the other attributes(Design, Functionality, Quality, Awareness, Advertising image, Event, Color, Popularity, Sophistication, Originality, Trust, Service) were in order of Yonex > Victor > Lining > Joobong > Trion. Second, as a result of ISA analysis, in I quadrant, Yonex showed functionality, quality, sophistication, and trust and Trion showed price, design, functionality and quality, Victor showed price, design, functionality, quality, color, sophistication, trust, service, and Joobong showed price, functionality, quality, and trust in this area. In quadrant Ⅱ as concentrated area, Yonex showed price and service, Trion showed color, trust, service, Victor showed price, Lining showed trust and service, and Joobong showed service in this area. In quadrant Ⅲ as low rank, Yonex showed advertising image, event, Trion showed awareness, advertising image, event, popularity, sophistication, originality, Victor showed advertising image, event, popularity, originality, Lining showed awareness, advertising image, event, popularity, originality, and Joobong showed design, advertising image, color, popularity, sophistication in this area. In quadrant IV as excess avoidance, Yonex showed design, awareness, color, popularity, originality, Victor showed awareness, Joobong showed awareness, event, originality in this area.


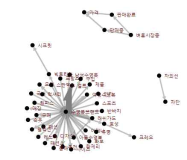
Purpose The purpose of this study was to examine the changing trends of swimsuit perception by using SNS big data. Methods By using “swimsuit” and “swimsuit brand” as key words, data was searched through blogs, cafes, Jisiksin(Tip), news, and web documents provided by naver and daum. This study used 2 years of data from January 1st, 2014 to December 31st, 2015 and social matrix program Textom was used for extracting matrix data and analyze them for frequency. To visualize data networking, NetDraw of UCINET6 program was used. Results Through analyzing the popular link words to the key words, it was known that the key words were 'swimsuit brand', 'children's swimsuit', 'rash guard', 'women's swimsuit', and 'model' in the order in 2014, and ‘swimsuit brand', 'rash guard', 'children's swimsuit', 'women's swimsuit', and 'Arena’ in the order in 2015. Second, the median of connectivity values showed that it was high in ‘swimsuit brand', 'women's swimsuit', 'children's swimsuit', 'rash guard', and 'Arena’ in the order in 2014, and ‘swimsuit brand', 'rash guard', 'women's swimsuit', 'children's swimsuit', and 'Arena’ in the order in 2015. Third, th results of CONCOR analysis demonstrated that ‘female customer’, ‘couple swimsuit’, 'rash guard', ‘brand’, 'children's swimsuit', and ‘fashion’ were grouped in 2014, and ‘brand’, ‘fashion’, 'rash guard', ‘purchase factor', and 'children's swimsuit' were grouped in 2015.