
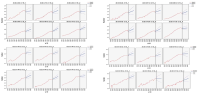
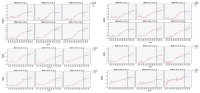
The present study has been carried out with a purpose of a long term estimation for the body size and BMI (Body Mass Index) of Korean children and youth using ARIMA, a time series model. In order to select an estimation model for the optimum time series, among the time series analysis method of SPSS22.0 statistic programs, a multivariate ARIMA (p,d,q) model has been selected that has an input series (physical education facility, time spent for physical education, animal source foods, GDP deflator, animal source food intake ratio), using annual average data of height, weight, and BMI data from 1965 to 2015. Among the several optimal measurements in ARIMA model with estimation variables, an optimal RMSE-based model (RMSE: Root Mean Square Error) has been selected. Using this model, the estimation model and estimated values of children’s height, weight, and BMI have been suggested for each age group. The results are as the following. The trend estimation of height follows a logistic curve, with both male and female groups showing increasing trends. The weight has a trend of increasing ratio higher than height. BMI also shows a trend curve similar to weight. The estimation model has been mostly ARIMA(0,1,0). In particular, the average BMI has been estimated as 22-23 for male students in 6th, 8th, 9th, 11th and 12th grade in 2030. This indicates the recent increasing obesity as children and youth occupy most of daily time for play culture that is far from physical activities, such as computer games, smartphone games, and video games at home.


[Purpose] This study evaluated the predictive power of Body Mass Index (BMI) for metabolic syndrome in older adults across pre-, during-, and post-COVID-19 periods, and examined the effects of metabolic syndrome factors on BMI by income level, aiming to inform elderly health management and crisis-related policies. [Methods] Data from 6,242 older adults (aged 65–80) were drawn from the 2019–2022 Korea National Health and Nutrition Examination Survey. Income was divided into quartiles, and time was segmented into pre-, during-, and post-pandemic periods. Multiple linear regression was used to assess the effects of metabolic syndrome factors (diabetes, abdominal obesity, low HDL, hypertension, hypertriglyceridemia) on BMI by income and period. Receiver Operating Characteristic (ROC) analysis evaluated BMI’s predictive power for metabolic syndrome. Significance was set at .05. [Results] Abdominal obesity and low HDL consistently influenced BMI across all groups. In the lowest income group, hypertension increasingly affected BMI during and after the pandemic. BMI Area Under the Curve (AUC) values peaked during the pandemic in this group, while the highest income group showed stable predictive power. [Conclusion] The COVID-19 pandemic had a differential impact on the association between BMI and metabolic syndrome among older adults according to income level. In low-income older adults, the predictive power of BMI for metabolic syndrome increased during the mid-pandemic period, while it remained stable across all periods in high-income groups. Systematic health management programs and policy interventions targeting low-income older adults are required to reduce health disparities during public health crises.
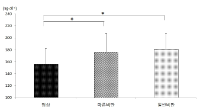
Purpose The present study compared physical fitness, metabolic syndrome risk factors, and resting metabolic rate (RMR) according to body mass index (BMI) and percent body fat (%BF) in 20s females. Methods Fifty-one women in their 20s were recruited and assigned into three groups, i.e., normal group (n=18), normal weight obesity (NWO) group (n=18), and obesity group (n=15) according to BMI and %BF. Physical fitness, metabolic syndrome risk factors, and RMR were measured and compared among three groups. Results Main results were as follows: 1) Physical fitness were not significantly different among three groups. 2) Regarding 1-RM, arm curl and leg extension were significantly lower in normal group and NWO group than obesity group. Leg press was significantly lower in normal group than obesity group. 3) Regarding metabolic syndrome risk factors, there were significant differences in waist circumference, ordering from low to high such as normal, NWO, and obesity groups. Systolic blood pressure and diastolic blood pressure were significantly lower in normal group and NWO group than obesity group, while HDL-C was significantly higher in normal group than NWO group and obesity group. 4) Regarding RMR, absolute values of RMR such as VO2(㎖·min-1), RMR (Kcal·min-1), RMR (KJ·min-1), and RMR (Kcal·day-1) were significantly lower in normal group and NWO group than obesity group. On the other hand, relative value of RMR such as RMR (KJ·kg-1FW·h-1) was significantly higher in normal group than NWO group and obesity group. Conclusions It was concluded that obese women showed increased risk of metabolic syndrome and low relative RMR level, and NWO had similar problems. Active health management through physical activity and dietary control should be committed to NWO individuals because the NWO has possibility of high risk of metabolic syndrome and reduction of metabolic rate from 20s even though there was no problem in their external appearance.
The primary purpose of the study was to compare cardiovascular function, mental health indices, stress-related variables according to body mass index (BMI) and percent body fat (%BF) in 20s females. Sixty-eight women, aged 20-29 yrs, participated in the study as subjects. There were three groups, i.e., normal group (BMI<24 kg·m-2 and %BF<25%; n=25), normal weight obese group (BMI<24 kg·m-2 and 28%<%BF<40%; n=19), and obese group (BMI>26 kg·m-2 and 28%<%BF<40%; n=24). Cardiovascular function, mental health indices, stress-related blood variables were measured and compared among three groups. Main results of the present study were as follows: 1) SBP, DBP, mean arterial pressure, and RPP were significantly higher in obese group than normal group. 2) There were no significant differences in mental health indices among three groups. 3) Fasting plasma insulin, fasting plasma glucose, and CRP were significantly higher in obese group than normal weight obese group and normal group. It was concluded that there would be abnormal cardiovascular function, insulin resistance, and inflammation in general obese individuals in 20s females, not normal weight obese and normal individuals.
The purpose of this study was to examine the relationship of obesity index, fitness and cardiovascular risk index in middle and high school students. Obesity index, fitness score and cardiovascular risk index were measured from 1,044 middle and high school students. The results of relation between obesity index and fitness showed that the higher obesity index had significantly lower fitness score for both boys and girls (boys: p<0.001, girl: p<0.05) The results of relation between obesity index and cardiovascular risk index indicated that the higher obesity index had significantly higher cardiovascular risk index for both boys and girls (boys: p<0.001, girl: p<0.001). Moreover, The lower fitness index showed significantly higher cardiovascular risk index regardless of gender in middle school students (boys: p<0.001, girl: p<0.01). Therefore, the results of this study indicated that obese adolescents had the lower fitness level and high possibility of cardiovascular risk.
PURPOSE High blood pressure and obesity pose significant health problems for older individuals. Previous studies showed that regular exercise improves physical fitness factors and decreases blood pressure and obesity. Therefore, this study investigated differences in blood pressure and obesity according to the physical fitness level of Korean older individuals using the National Fitness 100 data and used them to recognize the importance of maintaining physical fitness through regular physical activity or exercise for older individuals. METHODS From 2013 to 2019, a total of 218,848 subjects (men=74,271, women=144,577) aged ≥65 years who participated in the National Fitness 100 had their muscular strength, muscular endurance, cardiorespiratory endurance, balance, coordination, and flexibility measured, and they were ascribed a fitness level. Blood pressure, body mass index (BMI), percentage of bodyfat, and waist circumference were measured to compare the difference in fitness level. RESULTS There was a significant difference in the systolic and diastolic blood pressure in older men, and the diastolic blood pressure of older women by the fitness level (p<.001). In both older men and women, there was a significant difference in BMI, percentage of bodyfat, and waist circumference according to the fitness level (p<.001). CONCLUSIONS In conclusion, men and women showed different aspects in blood pressure, but Korean older individuals with having a high level of fitness managed their weight and body fat well. The decrease in obesity and improvement of physical fitness through regular physical activity and exercise could be a positive effect on maintaining health and extending healthy life years.
PURPOSE Increased body mass index (BMI) increases ankle instability and adversely affects human movement. This study aims to compare and analyze the muscle function and proprioception of the ankle joint based on Body Mass Index (BMI) to determine potential differences. METHODS Twenty-eight healthy male and female college students were categorized into overweight (≥ BMI 23) and normal (< BMI 23) groups. Measurements included BMI, isokinetic strength of dorsiflexion, plantarflexion, eversion, inversion, ankle joint range of motion, and ankle joint proprioception. RESULTS In dorsiflexion, right 30°/sec (p=.035), left 30°/sec (p=.009) and right 120°/sec (p=.011); in plantarflexion, left 30°/sec (p<.001), right 120°/sec (p=.007) and left 120°/sec (p=.006) in ankle inversion, left 30°/sec (p=.001), right 120°/sec (p=.021) and left 120°/sec (p=.007), left 30°/sec (p=.014), 120°/sec (p=.001) in ankle inversion-eversion ratio, right (p=.003) and left (p=.003) in ankle joint range of motion, right (p<.001) and left (p=.022) in total proprioception, and left (p<.001) in left-right proprioception were significantly different between the normal and overweight groups. CONCLUSIONS It was found that the overweight group had lower muscle strength, joint range of motion, and proprioceptive control function of the ankle joint than the normal group according to BMI. Therefore, exercise programs should be provided to strengthen the periarticular muscles involved in ankle movement, such as the tibialis anterior, soleus, and peroneus longus, and to control dynamic proprioception to prevent ankle injuries and function of the ankle joint according to BMI.
This study was designed to compare physical fitness, blood lipids, and insulin resistance according to body mass index (BMI) and percent body fat (%BF) in 20s females. Sixty women, aged 20-29 yrs, volunteered to participate in the study as subjects. There were three groups, i.e., normal group (BMI < 24 kg·m-2 and %BF < 25%; n = 25), normal weight obese group (BMI < 24 kg·m-2 and 28% < %BF < 40%; n = 22), and obese group (BMI > 26 kg·m-2 and 30% < %BF < 40%; n = 13). Physical fitness, blood lipid profiles, and surrogate indices of insulin resistance were measured and compared among three groups. Main results of the present study were as follows: 1) There were significant differences in all variables regarding body composition among three groups. All values were lowest in normal group and highest in obese group. 2) There was significant difference in sit-and-reach among three groups, whereas no significant differences were found in other variables regarding physical fitness among three groups. 3) There were significant differences in all variables regarding blood lipids among three groups. In particular, total cholesterol (TC), low density lipoprotein cholesterol (LDL-C), TC/HDL-C ratio, and LDL-C/HDL-C ratio were significantly higher in normal weight obese group than normal group. 4) There were significant differences in all variables regarding insulin resistance among three groups. Fasting plasma glucose and HOMA-IR were lowest in normal group and highest in obese group. It was concluded that there would be abnormal blood lipid profiles and insulin resistance in even normal weight obese individuals as well as general obese individuals in 20s females.

PURPOSE This study investigated the impact of underweight and hand grip strength (HGS) levels on the risk of all-cause mortality in older adults. METHODS Data from the 2006 baseline and 2020 follow-up assessments of the Korean Longitudinal Study of Aging (KLoSA), involving 3,009 older Koreans (≥65 years) were used in the study. Participants were categorized based on body mass index (BMI) as underweight, normal, overweight, or obese and grouped according to the Asian Working Group Sarcopenia criteria into high or low HGS. Cox proportional hazard models were used to estimate the hazard ratio (HR) and 95% confidence interval (CI) of all-cause mortality according to BMI and HGS categories. RESULTS During the 11.3±4.0 years follow-up period, 1,334 deaths from all causes occurred. The risk of death by BMI and HGS level was analyzed. The results showed that the risk of death in the overweight and high HGS group (HR=0.773, p=.016) was significantly lower than that in the normal weight & high HGS group (HR=1). In comparison, the risk of death in the underweight & low HGS group (HR=1.930, p<.001) and the normal weight & high HGS group (HR=1.225, p=.014) were significantly higher than normal weight & high HGS. However, the risk of death in the underweight and high HGS group showed no significant difference compared to the normal weight and high HGS group. CONCLUSIONS The current findings suggest that improving muscle strength through regular exercise may be important in preventing the risk of all-cause mortality due to being underweight.
Frailty in older adults is related to an increased risk for poor health outcomes including falls, disability, hospitalization and mortality. The purpose of this study was to determine the thresholds of a functional fitness associated with frailty for community-dwelling woman aged 65 or older. In this study, the National Fitness Award(NFA) items for elderly were utilized as the physical function and fitness testing for korean elderly women. The total of 444 community-dwelling woman completed the testings. Frailty status was classified by the Japan LTCI system ‘Kihon Checklist’ in the study. The prevalence of the frailty was 19.1% in the study. The frail elderly were older and showed higher obesity index such as weight, body mass index (BMI), percent body fat and waist circumference than the normal elderly. After adjusting for age and BMI which was related to frailty, fitness testing items were compared depending on frailty. As the result, the frail elderly showed significantly lower fitness levels in grip strength, 30-second chair stand test, timed up and go, figure-of-8 walk around two cones, and 2-minute step test than the normal elderly. When the fitness cut-off values were analyzed using the ROC curve, also, grip strength: 34.13%, 30-second chair stand test: 14 reps, timed up and go: 7.09 seconds, figure-of-8 walk around two cones: 30.88 seconds, and 2-minute step test: 93 reps. In addition, based on the cut-off values of each fitness item, the group with a low fitness level showed a 1.86 to 3.09 higher odds ratio of frailty than the group with a high fitness level, even after age and BMI were adjusted. In conclusion, these findings indicate that the fitness cut-off values in this study are fitness levels for preventing frailty of Korean elderly women and there will be a need for a large-scale study including subdivided fitness cut-off values for each age group and targets elderly men as well.