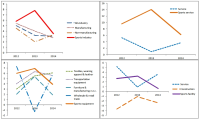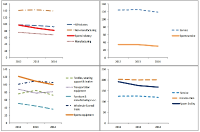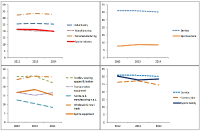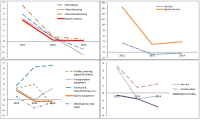
In this paper, we analyzed financial ratio of Sports Industry Enterprises in Korea from 2011 until 2014. We use Kis-Value data and extract 195 enterprise from it. And we compared the results with other industries which data were analyzed from the Bank of Korea. The results of the analysis are that the financial ratios of the sports industry is higher than other industries. This shows that the management conditions in sports industry are better than the other industries. In particular, among the sports industries, the management condition in sports service industry shows better states than other sports industries and other industries. This indicates that the sports service industry is a high value-added industry and growth rate of this industry is much faster than other industries. Growth rate of sales of Sports industry in 2014 was 0.1% whereas growth rate of sales of all industries was –1.5%. Also, growth rate of total assets of Sports industry in 2014 was 3.5% while growth rate of sales of all industries was 3.0%. So, growth ratio of the sports industry was higher than all industries. On the other hand, growth rate of tangible asset which represents the investment in fixed assets was 1.9%, which was lower than that of all industries 2.5%. Through operating income to sales, we can know the profitability of company from operating activities. Operating income to sales of sports industry in 2014 was 9.5% whereas operating income to sales of all industries was 4.3%. Especially sports service industry increased 24.6% in 2014. Income before income taxes to sales was 10.1%, which was higher than all industries 3.9%. In particular sports service industry was 28.3%. It shows that the sports service companies have issued a profit through strong corporate activities. Debt ratio of the sports industry in 2014 was 80.9% while it was 91.9% for all industries. Debt ratio of sports facilities industry was 166.9% that is higher than the average of all industries. But the debt ratio of the sports service industry was 29.9%, it can be seen considerably lower than the average of all industries. Total borrowings and bonds payable ratio of the sports industry was 19.8%, it can be seen lower than the 25.3 percent for all industries. Cash flow coverage ratio which represents the ability to afford the interest and debt to cash income. Sports industry rate was 25.4%. It was lower than the all industry's 62.7% and it indicates sports industry is financially not good. So, we know that sports service industry was financially not healthy. Business analysis results of sports industry of Korea appeared better than other industries. But business conditions are getting worse and, like any other industry. Thus, through the business analysis, we should prepare substantiality of management. And we should plan productivity improvement and business strategies for the changing business environment.