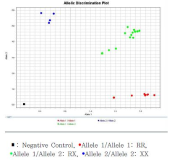
The ACTN3 R577X polymorphism has been associated with an elite athletes status. Several studies have determined that the R allele is connected with power-oriented athletic performance, whereas the nonfunctional XX genotype may give some beneficial effect for endurance performance. The main aim of the study was to determine the possible interaction between the ACTN3 R577X polymorphism and an power-oriented athlete status in Korean elite athletes(wrestling 31, judo 13, boxing 16, fencing 6, cycle 16, ≤400m athlete 18). Each athletes performed a 30-second WAPtest with a resistance equal to 7.5% for male and 5% for female body weight. Genotyping for the ACTN3 R577X (rs1815739) polymorphism was performed using the TaqMan approach. The ACTN3 R577X genotypes exhibited a HardyWeinberg equilibrium distribution in our population. The relative and absolute average power results of the 30-second Wingate test did not differ significantly among the genotypes. However, the relative peak power result of the Wingate test was significantly higher in the R-allele- dominant model groups than in the XX group in male but not female athletes. These results suggest that the ACTN3 R allele is associated with the relative peak power during the Wingate test in male Korean elite athletes.

PURPOSE The purpose of this study was to develop the estimating equations for 4 types of Wingate Anaerobic test setting. METHODS 80 male elite athletes performed 4 trials of the Wingate Anaerobic test by each type. Subjects were conducted the retest one week later. Data collected from the Wingate Anaerobic test included mean power, peak power, and power drop for 30s were measured. Coefficient of correlation was used for validity of type 1(DOS version) and the other types(ver. 2.24, 3.3.0, and 3.2.1). Pearson’s correlation coefficient was used to examine the reliability of test and retest. Simple regression analysis was used for calculating the estimating equation. RESULTS There was significant correlation for absolute value(Watt, p<.01) and relative value(Watt/kg, p<.01) of mean power, absolute value(W, p<.01), relative value(Watt/kg, p<.05), and power drop rate(%, p<.01). Test and retest reliability was excellent for all test variables(p<.01). CONCLUSIONS From the all results, the estimating equation was calculated to convert all outputs from each type to the other types of the Wingate Anaerobic test setting. These findings suggest that the estimating equations are compatiable to 4 types of Wingate Anaerobic test setting.
Purpose The purpose of this study was to investigate the differences in physique and physical fitness according to maturity between primary and middle school baseball players. Methods Participants were 112 elite youth baseball players (49 primary school; 63 middle school). Skeletal age estimated maturity. Physique (height, arm span, thigh volume), body composition (weight, muscle mass and body fat), physical fitness (strength, power, agility, flexibility, coordination, anaerobic power and aerobic power) were measured. An independent sample t-test was used to conduct verify the difference between physique and physical fitness according to maturity. Results The results of analyzing physical and physical fitness according to maturity showed that there was a significant difference (p<.05) between the early maturation group and on-time group in primary school baseball players, body fat percentage, muscle mass percentage, sit-up, anaerobic power and reaction time. There was a significant difference between the early maturation group and the on-time group in the middle school baseball players, weight (p<.05), thigh volume (p<.05), fat mass (p<.05), muscle strength (p<.01), power (p<.05) and coordination (p<.05). Conclusions In conclusion, the maturity of a growing baseball player may be influenced by the performance, so maturity status should be considered when judging the performance of a growing baseball player, especially a middle school baseball player.