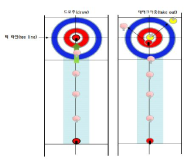
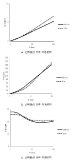
In this paper, we tried to find out the difference of CoM displacement, CoM velocity and Foot-pressure between draw motion and takeout motion in curling’s delivery motion. To do this, we experimented for 10 female athletes of curling national team(all athletes are in her 20th~30th ages) to carry out draw motion and takeout motion from backline to near hogline in state of speed limit. The limited speed was 3.80~3.90 sec for draw and 2.97~3.07 sec for takeout. From the experiments, we obtained the result like followings. 1. Draw motion is more increase than takeout motion in displacement of horizontal direction of CoM displacement. 2. Takeout motion is more increase than draw motion in displacement of vertical direction of CoM displacement. 3. Takeout motion is faster than draw motion in both of horizontal and vertical direction of CoM max. velocity. 4. Takeout motion is higher than draw motion in pressure of fore-foot and mid-foot of foot-pressure 5. Draw motion is higher than takeout motion in pressure of fore-foot and mid-foot of foot-pressure These result means that the characteristics of techniques for draw motion and takeout motion is differ from each other and it is necessary to take different training protocol individually to enhance athletes’s performance. And further research will contains another things like that the pursuit of curling stone’s rut by various delivery techniques
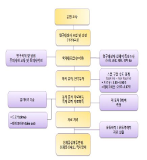


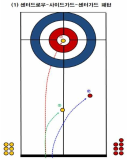
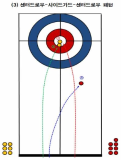
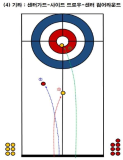
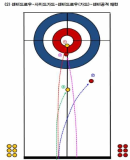
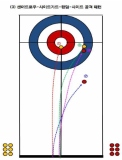
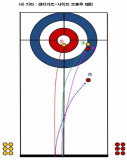
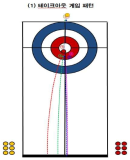
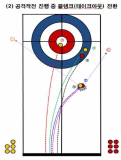
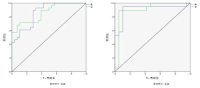
This study has analyzed 33 domestic games and 26 overseas games by targeting women curling teams of home and abroad, and looked into what main performance variables are, how level differences of domestic team appear, and from which variables differences between winning team and defeated team come out in overseas teams. Also, main strategies has been suggested that are used most commonly for kick-off offense and latter offense, blank strategy in order to prepare countermeasures, and digital media DB has been constructed that can utilize proper countermeasures easily and simply, and a model has been proposed for predicting victory/defeat. To accomplish such goal, a variance analysis has been carried out by dividing domestic teams into each level after calculating frequency and ratio with SPSS18.0, and t-test analysis has been carried out by overseas teams. Also, the accuracy of victory/defeat classifications has been suggested by using an artificial neural networks method. As a result, a lot of technical proficiency differences have appeared among Class A(upper rank), Class B(middle rank), and Class C(lower rank) in domestic teams. The ‘Guard’ which is an aggressive variable has turned out to be used more in upper and middle teams than in lower team, and the ‘Tab Back’ has been used more in upper rank than in lower rank. Furthermore, regarding the average comparison on victory/defeat in international games, victory teams have more significant difference(p<.05) than defeated teams in accuracy of shot techniques and strategy accomplishing abilities, and victory teams have been turned out to use less ‘Drew’ and more ‘Take’ than defeated teams significantly in Drew and Take’ technique variable. Finally, the accuracy of a prediction model has been 91.7% for learning and 92.9% for the test result to predict the victory/defeat in international games through the artificial neutral network analysis. The prediction accuracy of domestic games was 81.0% for learning and 71.4% for the test.